Site analytics
Every TrueTone website comes with built-in analytics. With no setup on your part, TrueTone counts anonymous visits and shows you how many people came, which pages they read, where they arrived from, and who is browsing right now. You can export a report anytime, or connect your own Google Analytics if you prefer.
What it is
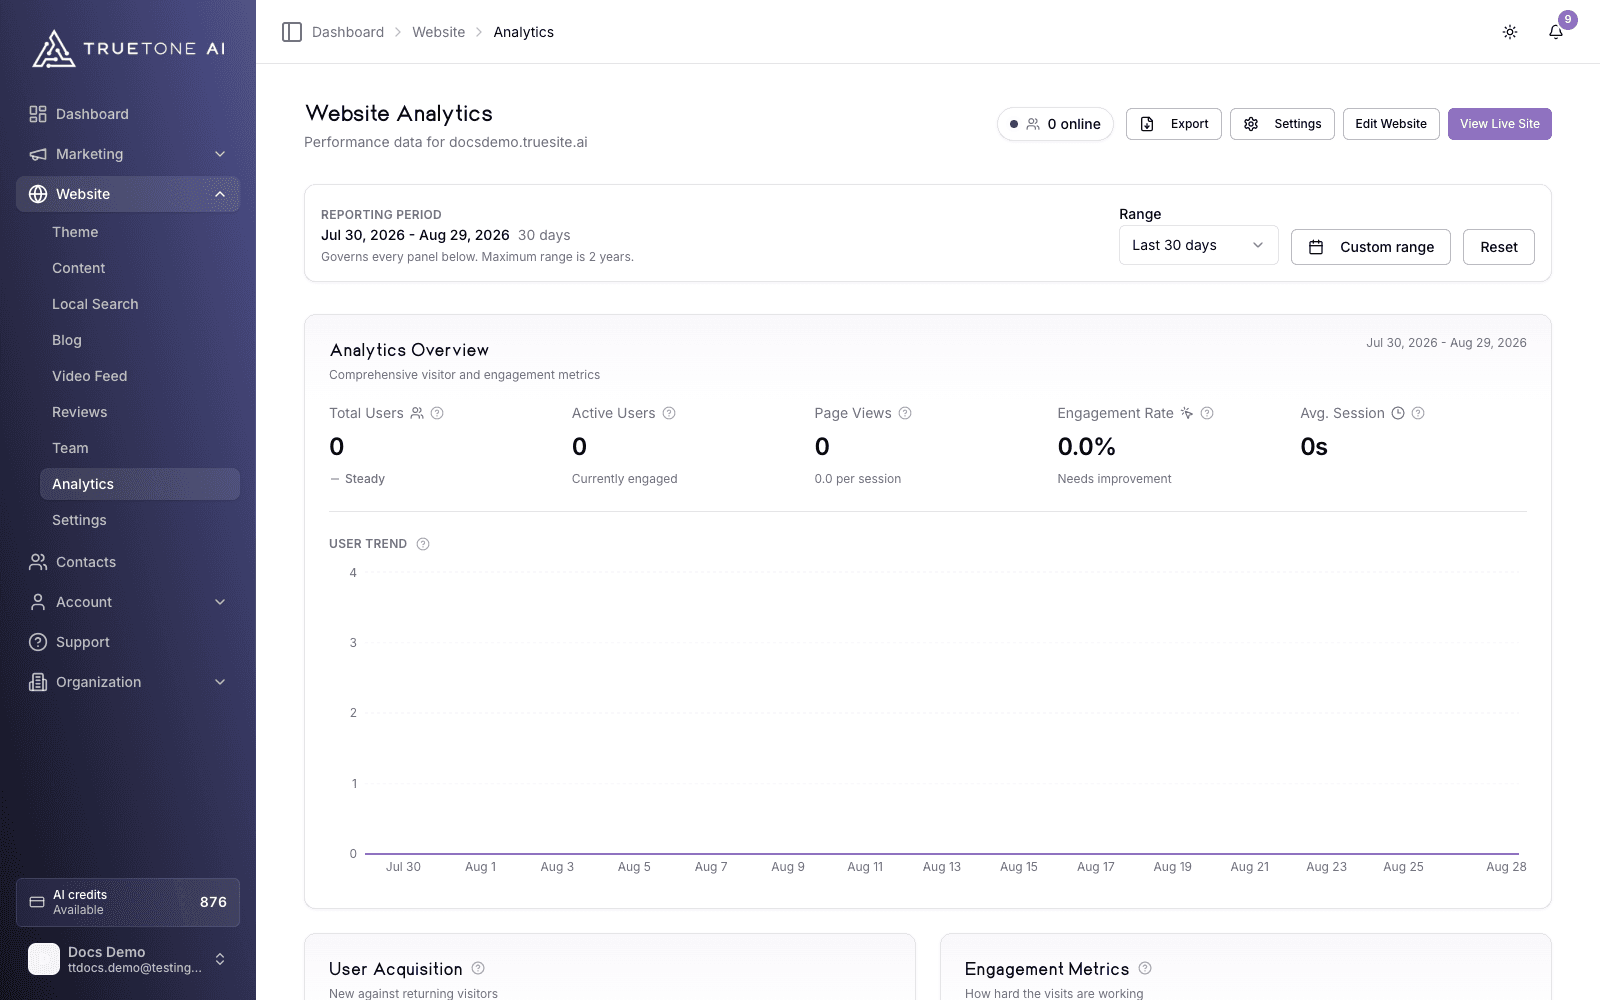
Site analytics lives under Website in your dashboard, on the Analytics page. It reports on your live TrueTone website so you can see whether your content is reaching people and which pieces are landing.
The dashboard opens on the last 30 days and covers a few essentials:
- Visitors and page views: how many people came and how many pages they opened.
- Top pages: which pages drew the most reads, ranked.
- Traffic sources: where visitors arrived from, such as Google, Bing, LinkedIn, X, Facebook and Instagram, or direct visits.
- Devices: how your audience splits across desktop, mobile, and tablet.
- Visitors online now: a live count of people on your site in the last few minutes.
Collection is anonymous. TrueTone counts a visit and notes the page, the source, and the device category. It does not identify individual visitors, so you get a clear read on reach and interest without collecting personal details about the people browsing.
Who it is for
Any loan officer with a TrueTone website who wants to know if their site is working. When you publish a new blog post or share your site, analytics tells you whether people showed up and what they read, so you can do more of what draws attention.
If you are on an enterprise plan, your organization administrators can view analytics for your site as well. Otherwise the data is yours.
How to read your dashboard
Open the Analytics page
In the dashboard, go to Website, then Analytics. The page names the site it is reporting on at the top.
Set your date range
Use the range picker to choose the last 7, 14, 30, or 90 days, or open the calendar to pick an exact start and end date. You can look back up to two years. The whole dashboard updates to match the range you choose.
Read the numbers
The overview shows your visitors and page views for the range, with a trend chart so you can see the shape of your traffic over time. Below it, Top pages, Traffic sources, and Devices break the same period down so you can see what is working.
Check who is online now
The green “online” pill near the top shows how many people are on your site in the last few minutes. Click it anytime to refresh the count.
Export a report
Use the Export button to download the current range as a PDF report or a CSV spreadsheet. Both include your visit totals, top pages, traffic sources, and device breakdown, so you can share results or keep your own records.
Connecting your own Google Analytics
TrueTone runs your analytics automatically, but if you already use Google Analytics 4 (GA4) or want its deeper reporting, you can connect your own property instead. This is a self-serve control on the Analytics page.
Open analytics settings
On the Analytics page, click Settings. You will see two choices: Managed (the TrueTone default) and Connected GA4.
Choose Connected GA4 and add your ID
Select Connected GA4 and paste your GA4 Measurement ID, which looks like G-XXXXXXXXXX. TrueTone adds that tag to your live site for you.
Save
Once you save, your visits flow into your own Google Analytics account, and you view the reports there.
Connecting GA4 pauses TrueTone’s built-in collection. While your own tag is active, the TrueTone dashboard stops filling with new numbers because your data is going to Google Analytics instead. The two are kept separate: TrueTone does not merge or backfill data between them, so switching starts a fresh record on whichever side is active. You can switch back to Managed at any time, and built-in collection picks up again from that point.
Adding GA4 places Google Analytics tracking on your site. Make sure your privacy policy and any cookie or consent notice match how you have set up Google Analytics.
Good to know
The built-in dashboard is a lightweight, privacy-first measure. It is built to answer the questions that matter most day to day, such as how many people came, what they read, and where they came from, rather than to replace a full analytics suite. If you need deeper behavioral reporting, connect your own GA4 as described above.
- Visits refresh on their own. The dashboard updates as new activity comes in, and the “online now” count reflects the last few minutes, so it is the freshest number on the page.
- “Online now” only works in the built-in mode. If you have connected your own GA4, the live count reflects TrueTone’s collection, which is paused, so watch your live visitors in Google Analytics instead.
- Nothing to install. Built-in analytics is on the moment your site goes live. There is no tag to add and no configuration to complete unless you choose to connect GA4.
- Your data stays with your site. Analytics is scoped to one website, so the numbers you see belong to that site alone.